

Reef Rescue Marine Monitoring Program - Project - Assessment of terrestrial run-off entering the Great Barrier Reef (ACTFR-JCU) - Deprecated
There is an updated version of the details of this part of the MMP monitoring program.
As part of the Reef Rescue Marine Monitoring Program (MMP), our project has been monitoring riverine flood plumes to assess concentrations and transport of major land-sourced pollutants to the Great Barrier Reef (GBR) lagoon. The exposure of GBR reef and seagrass ecosystems to contaminants is estimated from the synthesis of: river discharge, water quality data sampled in inshore sites during flood conditions and the use of remote sensing technology to estimate flood plume extents and duration.
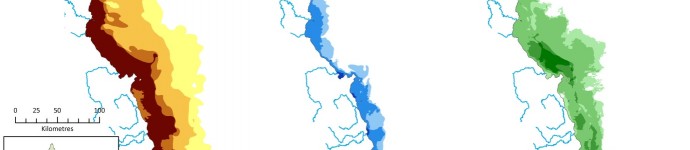
Three water types resulting from river floods have been identified and mapped over the GBR: (i) a “primary” water type characterized by high total suspended sediment values found in low salinity flood plume water; (ii) a “secondary” water type characterised by high phytoplankton biomass and elevated concentrations of coloured dissolved and detrital matter (CDOM) and (iii) a “tertiary” water type characterised by elevated CDOM+D (Figure 1)
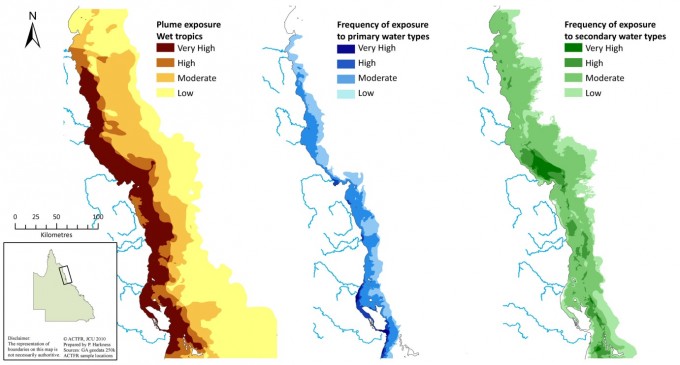
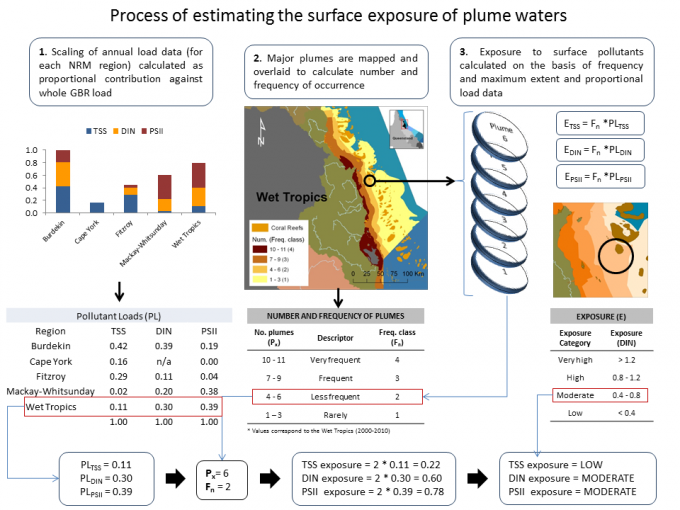
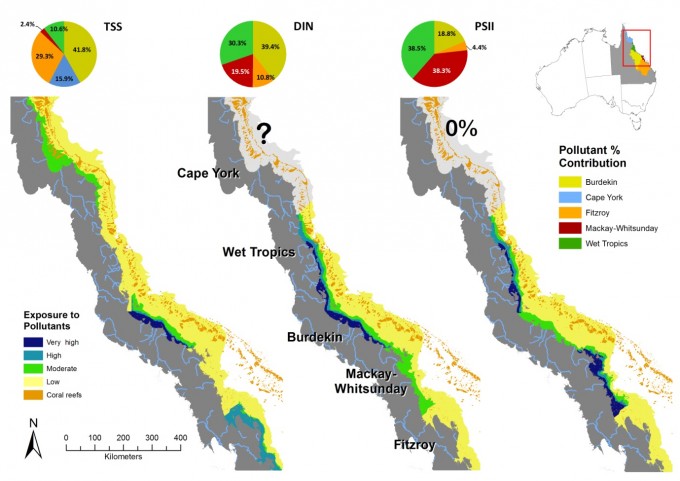
The extent of land-sourced pollutants in the GBR lagoon is calculated by combining mapped flood plumes (Figure 1) and pollutant loads (for example, Figure 2). When all this information is combined from a temporal and spatial perspective, we have a powerful tool for the prioritisation of the management of the catchments affecting the GBR Marine Park. For example, long term exposure to flood plumes carrying high dissolved inorganic nitrogen loads (DIN) (Figure 3) occurred in 19% and 11% of the total marine portion of the Wet Tropics and Burdekin regions, respectively.
Data sources are as follows:
River discharge
Daily river discharge and load data of the main rivers in North Queensland is acquired from the Department of Environment and Resource Management (http://watermonitoring.derm.qld.gov.au/host.htm). This data have been used to identify peaks of river discharge into the GBR lagoon, predict when bigger and more persistent plumes are likely to happen, and to estimate terrestrial inputs into the marine ecosystem.
Water quality sampling
Flood plume sampling during the North Queensland wet season (Dec – May) is carried out annually on an ad-hoc basis dependent on region of flooding. Plume water quality is measured through a combination of in situ water quality measurements (link to metadata) taken at peak and post flow conditions. Sample collection is typically focused on near-shore sites and river mouths and includes analysis of temperature, salinity, total suspended sediment, chlorophyll-a, nutrients, and pesticides and phytoplankton.
Flood plume extent and duration
Given the large size of the GBR Marine Park (350,000 km2), river plume extent, frequency, duration and composition are measured through the use of remote sensing products. Images from Moderate Resolution Imaging Spectroradiometer (MODIS) on-board the NASA Earth Observation System Terra and Aqua spacecrafts are downloaded from the NASA web page (https://oceancolor.gsfc.nasa.gov/cgi/browse.pl?sen=am) as Level-0 data, and processed to extract several Level-2 products and true colour image. Water quality data are then used to validate the remotely sensed data.
Detailed information on the movement, frequency, spatial extent and composition of surface plumes in the GBR is attained by the use of innovative spatial analysis techniques, which integrate daily river discharge and load, water quality data and remote sensing products (Meta-data Table, link to meta-data).
Key results and messages
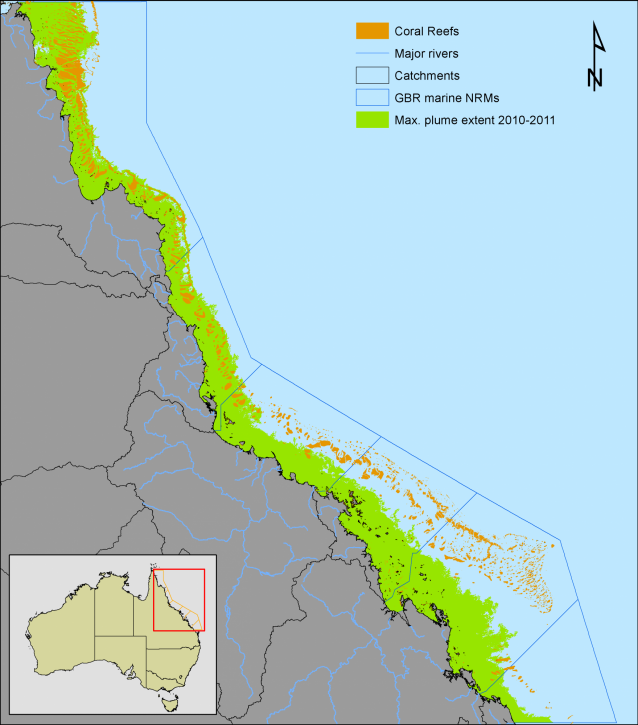
Water quality sampling over the past four years under the MMP has been focused on the Burdekin, Fitzroy and Tully catchments. Sampling has also occurred less frequently in the Mackay Whitsunday region and Russell-Mulgrave. Previously to the MMP program, there has been sporadic sampling over a period of 18 years over all the GBR catchments. . Table 1 shows some typical concentrations in the plume waters over the GBR (average of all the historical data from 1991-2010). Plume movement in the GBR can be over a significant proportion of the GBR, as shown in the extent of the 2010-11 plumes (Figure 4).
GBR ecosystems such as coral reefs and seagrass beds are likely to reflect and respond to distinct regional differences in water quality driven by the occurrence and frequency of high river flow periods. The process of transport, delivery, and effect of these higher pollutant concentrations need to be continually measured and monitored
| Catchment | Salinity | TSS (mg/l) | Chl (ug/l) | DIN (uM) | DON (uM) | TN (uM) | TP (uM) |
|---|---|---|---|---|---|---|---|
| BARRON | 29.16 | 18.66 | 1.18 | 3.66 | 7.29 | 7.23 | |
| BURDEKIN | 22.03 | 34.13 | 1.11 | 5.30 | 8.44 | 16.82 | 1.14 |
| DAINTREE | 26.87 | 10.69 | 0.81 | 1.75 | 4.50 | 6.30 | |
| FITZROY | 24.70 | 29.47 | 3.19 | 1.50 | 10.19 | 13.85 | 1.01 |
| HERBERT | 28.15 | 16.08 | 1.79 | 3.16 | 9.92 | 11.16 | |
| JOHNSTONE | 29.27 | 7.29 | 1.03 | 3.55 | 7.58 | 8.04 | 0.87 |
| LOWER BURDEKIN | 23.33 | 65.04 | 4.35 | 9.44 | 19.85 | 2.45 | |
| MACKAY-WHITSUNDAYS | 32.93 | 6.07 | 0.90 | 0.74 | 5.33 | 6.07 | 0.47 |
| OCONNELL | 3.97 | 2.06 | 1.60 | 8.30 | 13.62 | 1.09 | |
| RUSSELL-MULGRAVE | 30.16 | 18.38 | 1.13 | 1.24 | 7.47 | 8.50 | 0.47 |
| TOWNSVILLE | 18.06 | 25.77 | 1.02 | 5.06 | 8.34 | 19.12 | 1.77 |
| TRINITY | 14.63 | 1.58 | 9.64 | 13.19 | 37.63 | ||
| TULLY-MURRAY | 26.87 | 12.49 | 1.15 | 3.22 | 6.00 | 9.26 | 0.61 |
Reports from this project
These reports cover the work of this project in detail:
- Flood plume monitoring 2009-2010 (8.7 MB)
- Flood plume monitoring 2008-2009 (4.9 MB)
- Flood plume monitoring 2007-2008 (6.3 MB)
Project meta-data
The data collected by this project is described in more detail in the following meta-data record.
Maps in the e-Atlas
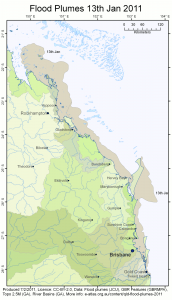
Flood plumes for 2011 wet season
Extent of the flood plumes of the Fitzroy, Burnett, Mary and Brisbane Rivers caused by the extensive flooding that occurred in Queensland in December 2010 and January 2011.
- Fitzroy, Burnett, Mary River Flood Plume (31st December 2010, 4th, 7th, 11th and 13th January 2011)
- Brisbane river flood plume (3rd, 13th, 18th January 2011)
Available in e-Atlas web mapping client under: Geography and Environment/QLD: Flood plumes 2011 (JCU)
For more information see QLD - Flood Plumes 2011 (JCU, AIMS)
| Attachment | Size |
|---|---|
| 97.14 KB |