
Recent datasets
This research was conducted to understand the relationship between water quality and ecological attributes on coral reef communities, through field surveys on naturally turbid inshore coral reefs that vary in exposure to water bourne sediment, nutrient and chlorophyll concentrations. Reefs in two regions were surveyed for biodiversity of algae, hard corals, octocorals and fish. Region PC: Princess Charlotte Bay (in the Claremont Isles, north of PC Bay) and and Region WT: Wet Tropics (between Tully and Port Douglas).
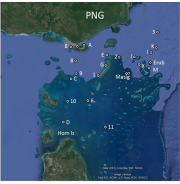
This dataset summarises the results of a survey to determine the concentration of trace metals from mine-derived pollution in marine waters and sediments across the Torres Strait during October 2016. Sampling was performed by a CSIRO team between 3 and 16 October 2016 on board the MV Eclipse. Surface water samples were collected from 21 sites using strict sampling protocols that are designed to minimise contamination (USEPA, 1996; Angel et al., 2010b).
METHODS:
This dataset summarises the results of a survey of water quality and suspended solid metal data for ten (10) sites around Saibai and Boigu Islands in the Torres Strait during November 2018. This is the second survey for this project, where the first survey identified the area around Saibai as having elevated metal concentrations compared to other areas of the Torres Strait. This survey was conducted to investigate this finding. Water samples were collected from five sites around Saibai Island and five sites around Boigu Island.
METHODS:
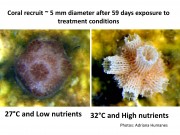
This dataset shows the measured response of early life history stages to different levels of nutrient enrichment and temperatures in experiments conducted in 2014-2015.
The data is presented as one Excel spreadsheet file. Each tab contains data from experiments (Exp. 1a,b; Exp 1c,d; Exp. 2; Exp 3) on different life stages exposed to the same conditions. Measured logged water quality (Nutrients) and temperature (Temperature) data taken during the experiment are also presented in different tabs.

This dataset consists of one data file presenting data from 4 experiments conducted under aquarium controlled conditions manipulating levels of suspended sediments, temperature and nutrient enrichment. The experiments measured the conditions effect on early life history stages like gamete fertilisation success, embryo development, larval survivorship and larval settlement of the coral Acropora tenuis.
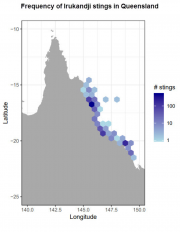
This dataset presents the code written for the analysis and modelling for the Jellyfish Forecasting System for NESP TWQ Project 2.2.3. The Jellyfish Forecasting System (JFS) searches for robust statistical relationships between historical sting events (and observations) and local environmental conditions. These relationships are tested using data to quantify the underlying uncertainties. They then form the basis for forecasting risk levels associated with current environmental conditions.
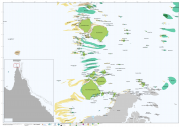
This dataset consists of a shapefile of the reefs, islands, sand banks, cays and rocks of the whole Great Barrier Reef (GBR) including Torres Strait. This dataset is an extension of the mapping in the GBR Marine Park to include Torres Strait. The Torres Strait region was mapped at a scale of 1:50,000 (Lawrey, E. P., Stewart M., 2016) and these new features are referred to as the "Torres Strait Reef and Island Features" dataset.

This dataset contains the amalgamated set of Special Management Areas (SMAs) in the Great Barrier Reef Marine Park as described in the Great Barrier Reef Marine Park Regulations 1983, Amendments 2008. This includes:
SMA - No Dories Detached,
SMA - Princess Charlotte Bay,
SMA - Public Appreciation,
SMA - Restricted Access,
SMA - Seasonal Closure,
SMA - Dugong Protection Area B,
SMA - Dugong Protection Area A,
SMA - Natural Resources Conservation
Dugong Protection Areas:
This dataset contains polygon features that represent the zoning classification of lands within the Wet Tropics World Heritage Area, according to the Wet Tropics Management Plan 1998.
This dataset is a working depiction only. For legal confirmation, refer to signed maps held at WTMA.
http://www.wettropics.gov.au/boundary-maps

This phase of Project 3DGBR involved manual digitising of geomorphic map boundaries for the key seafloor features identified in the gbr100 grid, particularly for the inter-reefal area on the GBR shelf and in the Coral Sea Conservation Zone (CSCZ). See map for CSCZ boundary at: https://www.environment.gov.au/topics/marine/marine-reserves/coral-sea/c...
Methods:

The purpose of this study is to quantify spatial and temporal patterns in water quality of the GBR.
Surface water quality data collected by Miles Furnas and colleagues (AIMS) between 1988 and 2006. Niskin or bucket surface water samples and laboratory analyses of a suite of physical and chemical water quality data, including chlorophyll, suspended solids (SS), and the following nutrients: particulate phosphorus (PP), particulate nitrogen (PN), total dissolved phosphorus (TDP), total dissolved nitrogen (TDN), total phosphorus (TP = PP + TDP), total nitrogen (TN = PN + TDN).

This dataset contains contours generated from the Australian bathymetry and topography grid, June 2009 version 4 by Geoscience Australia. It contains depth contours for -20m, -40m, -100m, -200m and -400m.
Contours were generated in ArcMap using the Spatial Analyst Tools / Surface / Contour List tool. This output was then simplified using the Cartography Tools / Generalization / Smooth Line with a tolerance of 300m.

This dataset contains line and point features depicting contours across the Wet Tropics Bioregion as shown on the 1:50,000 scale National Topographic Maps.
The dataset derives from Geoscience Australias 1:50,000 scale National Topographic Map Series data.
Accuracy: Horizontal accuracy is at 90% of well-defined detail within +/- 25m of true position.
Data reproduced with permission of Wet Tropics Management Authority.

This dataset contains point features depicting spot heights for the Wet Tropics Bioregion.
The SpotHeight-250K dataset was sourced primarily from the 1:250 000 scale National Topographic Map Series (NTMS) and the Royal Australian Survey Corps Joint Operation Graphics (JOG) map reproduction material (repromat).
This dataset consists of a 25 MB shapefile containing 134,007 point features.
*Accuracy*
Horizontal accuracy is at 90% of well-defined detail within +/- 125m of true position. The dataset has an attribute accuracy of 100%.

The GEODATA TOPO 2.5M 2003 product is a national seamless data product aimed at regional or national applications. It is a vector representation of the Australian landscape as represented on the Geoscience Australia 1:2.5M general reference maps and is suitable for GIS applications.
It supersedes the TOPO 2.5M 1998 product by being developed according to GEODATA standards as described below. The data was derived from GEODATA TOPO 250K Series 2 data where available and GEODATA TOPO 250K Series 1 and has double precision accuracy.
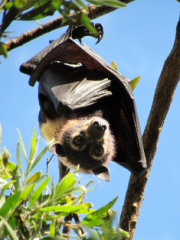
This data set shows the occupancy and size of spectacled flying-fox camps across the distribution of the spectacled flying-fox in the Wet Tropics Region. Camp locations are also provided. Data was collected monthly and all camps in the region were monitored each month.

The purpose of this data set was to compile distributional, general life-history characteristics and phylogenies for Australian tropical rain forest vertebrates to inform a wide range of comparative studies on the determinants of biodiversity patterns and to assess the impacts of global climate change.

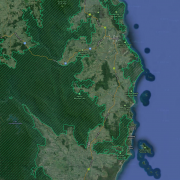
This dataset contains Landsat 5 imagery for selected areas of Queensland, currently Torres Strait and around Lizard Island and Cape Tribulation.
This collection was made as a result of the development of the Torres Strait Features dataset. It includes a number (typically 4 - 8) of selected Landsat images for each scene from the entire Landsat 5 archive. These images were selected for having low cloud cover and clear water. The aim of this collection was to allow investigation of the marine features.

This project seeks to ensure that planning for the future development of the Torres Strait Islands is sustainable and capable of taking into account ecological and social information, assets, risk and existing infrastructure.
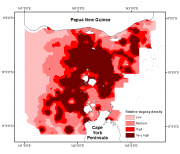
This dataset shows (1) a raster spatial model of the distribution and relative density of dugongs (Dugong dugong) in the Torres Strait region based on an aggregate of 27 years (1987 - 2013) of systematic aerial surveys; and (2) a raster spatial model of the distribution and relative density of marine turtles (green turtles, Chelonia mydas) in the Torres Strait based on an aerial survey conducted in 2013.