
Recent datasets

This dataset is consists of modelled habitat suitability of coastal seagrass distribution in the wet and dry seasons along the Great Barrier Reef World Heritage Area coastline.
A Bayesian belief network was used to quantify the relationship (dependencies) between seagrass and eight environmental drivers: relative wave exposure, bathymetry, spatial extent of flood plumes, season, substrate, region, tidal range and sea surface temperature.

This dataset shows the estimated maximum temperature of the warmest period for the Wet Tropics Bioregion of North Queensland over a 24 month period from January 2007 to December 2008. It was modelled based on weather station data, elevation, foliage cover and distance to the coast. The purpose of this dataset is as a metric for estimating thermal stress on animals living in this region.
Methods:
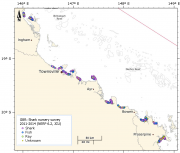
This dataset contains the catch data from seasonal gillnet and longline surveys of shark nursery areas in the Central Section of the Great Barrier Reef Marine Park (2011-2014).
Methods:

This dataset contains coastal features within and adjacent to the Great Barrier Reef World Heritage area. This dataset consists of two shapefiles GBR_FEATURES.shp and GBR_DRY_REEF.shp. The GBR_FEATURES shapefile contains the following features:
* Queensland mainland coastline,
* Major and other coral reef structures (as defined by the reef shoal edge),
* Islands and rocks (exposed and submerged),
* Major coral cay features.

This dataset corresponds to the zoning within the Great Barrier Reef Marine Park effective 1st July 2004. It is derived from the Great Barrier Reef Marine Park Zoning Plan 2003.

1:100,000 coastal wetland vegetation mapping for the Queensland coastline including mangrove communities, saltpans and saline grasslands. Mangrove areas are classified based on the dominant genus (Ageiceras, Avicennia, Ceriops, Bruguiera, Rhizophora).
This dataset was derived from automatic classification of 25m resolution Landsat TM images, colour aerial photography and ground truthing. The resulting data has a positional accuracy of 100 meters and a classification accuracy of approximately 80%.

The aim of this component of the Reef Rescue Monitoring Program is to assess trends in the concentrations of specific herbicides and pesticides, primarily through routine monitoring at sites (Green Island, Low Isles, Fitzroy Island, Normanby Island, Dunk Island, Orpheus Island, Magnetic Island, Cape Cleveland, Pioneer Bay, Outer Whitsunday, Sarina Inlet, North Keppel Island) within 20km of the Queensland coast. The monitoring year for routine pesticide sampling is from May to April.

This dataset consists of site and zone means of the percent cover of major benthic categories and the density of fish functional groups on fringing coral reefs of the Keppel Island group, as a result of monitoring surveys carried out in 2015.
This data extract summarises the results of the October 2015 survey of reef communities in the Keppel Island group. The data is a component of a long-term monitoring project that assesses the effects of no-take marine reserve zoning on inshore reefs of the Great Barrier Reef Marine Park.

This experiment grew adult Echinometra sp. A sea urchins under four temperature and pH treatments 28 / 7.9, 28 / 8.1, 31 / 7.9, 31 / 8.1 (degrees C, pH) to investigate the interactive effects of warming and acidification on their physiology. These treatments were chosen to match those that may be experienced in the near-future (2100) due to climate change. Each treatment was replicated across 3 aquaria, each with 6 individuals for a total of 72 sea urchins.
Method:

As part of MTSRF Project 4.8.1, this study aimed to assess the benefit of no-take (green) zones as a recruitment source. 1342 adult stripey snapper (Lutjanus carponotatus) from 3 green zones around the Keppel Islands were fin-clipped for genetic analysis and released. Microsatellite markers were used to assign juveniles to one or both parents. From the 483 juveniles collected from 16 sites in both green and blue zones, 140 (~30%) were assigned to one or both parents from the adult sample.
This metadata is a brief overview of the National Environmental Research Program Tropical Ecosystems (NERP TE) Hub and a metadata parent record for all datasets and projects developed as part of this research program.
This dataset consists of one data file (spreadsheet) from a 1 year large tank herbicide degradation experiment in seawater, containing 4 different light and sediment treatments. Each tab contains concentration data at each time point for a single herbicide under each of the four light and sediment conditions. \n \nThe aim of this study was to conduct a year-long degradation experiment using concentrations of commonly detected herbicides in a series of replicate open tanks.
This dataset consists of 107 days of vessel tracking using the Automatic Identification System (AIS) at 1 hour intervals extracted for the Queensland region from the Spatial@AMSA Historic Vessel Tracking website (AMSA 2013). It has been converted to Shapefile format and contains just under 1 million points.
Presence information for sharks and fish fitted with acoustic transmitters on reefs in the Townsville region. Acoustic receivers are deployed on: Bramble (4), Rib (4), Kelso (2), John Brewer (4), Lodestone (4), Helix (4), Keeper (2), Glow (3), Cotton Shoal (1), Arc (1), Grub (4), Yankee (3), Centipede (2), Wheeler (5), Davies (2), Pinnacle (1) and Little Broadhurst (2) reefs. Transmitter life ranges from 12-30 months. Transmitters report depth data to indicate position of the animal in the water column.
This dataset is a composite of Landsat 5 satellite imagery to produce a cloud free, clear water seamless image of the Torres Strait region. This image includes some of Cape York and PNG, in particular the Fly river. This composite shows clear imagery for marine areas, in particular reefs, larger islands and sand bars.
This image has a resolution of approximately 30 m and a positional accuracy of better than 50 m.

This dataset shows the ocean side boundary of the Great Barrier Reef Marine Park, excluding the inner boundary along the Queensland coastline.
This dataset was derived from the Great Barrier Reef Marine Park Boundary dataset by loading the GBRMPA_BOUNDS_Line.shp (supplied by GBRMPA) into ArcMap then deleting the verticies along the coastline, breaking the original closed line loop.
This dataset is not authorive and was produced for use in the eAtlas. Contact the Spatial Data Centre at GBRMPA for the official boundaries.
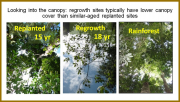
This data set describes change in forest attributes over time in response to passive regrowth and biodiverse ecological restoration plantings across the southern Atherton uplands. These data were obtained from four sets of spatially replicated site-types: (1) a chronosequence of 29 passive regrowth sites (1-67 years) on previously forested land with a subsequent period of land use for agriculture (e.g.

This dataset contains data on carbon chemistry on inshore reefs of the Great Barrier Reef (GBR). Main parameters measured were temperature, total alkalinity and dissolved inorganic carbon. The data was collected six times over two years (September 2011 - June 2012) covering a comprehensive latitudinal range.
The aim of this study was to investigate carbon chemistry on inshore reefs, and compare it to offshore reefs and historical data.

This dataset measures 5 effects of temperature and pH stressors (individual and combined) on tropical Foraminifera. The effects measured are: respiration, survivorship, growth, chl-a content and photochemistry. The study was conducted in 2011 and the data is provided as 5 single sheet spreadsheets.

This dataset consists of one data file from a 16 day aquarium experiment manipulating pH and light level and measuring growth, photosynthesis, calcification and pigment content of Acropora millepora.
The aim of this study was to test the hypothesis that a combined effect of decreased pH and decreased light on physiological responses of the coral is larger than that of each stressor individually.
Method: